


Title:Estimating China’s poverty reduction efficiency by integrating multi-source geospatial data and deep learning techniques
Abstract
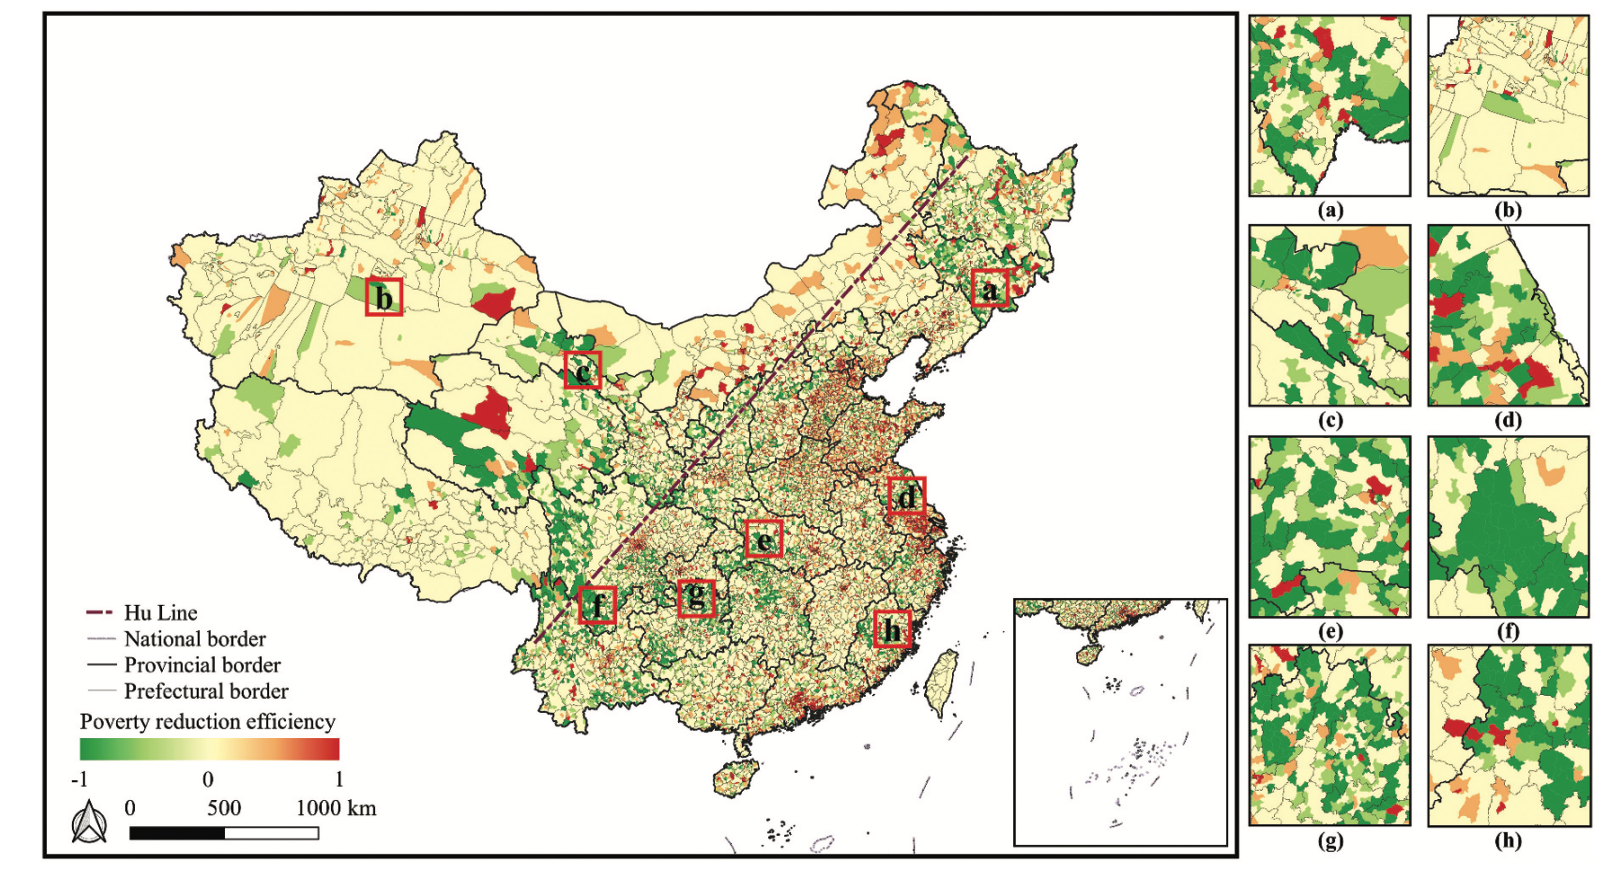
Poverty threatens human development especially for developing countries, so ending poverty has become one of the most important United Nations Sustainable Development Goals (SDGs). This study aims to explore China’s progress in poverty reduction from 2016 to 2019 through time-series multi-source geospatial data and a deep learning model. The poverty reduction efficiency (PRE) is measured by the difference in the out-of-poverty rates (which measures the probability of being not poor) of 2016 and 2019. The study shows that the probability of poverty in all regions of China has shown an overall decreasing trend (PRE = 0.264), which indicates that the progress in poverty reduction during this period is significant. The Hu Huanyong Line (Hu Line) shows an uneven geographical pattern of out-of-poverty rate between Southeast and Northwest China. From 2016 to 2019, the centroid of China’s out-of-poverty rate moved 105.786 km to the northeast while the standard deviation ellipse of the out-of-poverty rate moved 3 degrees away from the Hu Line, indicating that the regions with high out-of-poverty rates are more concentrated on the east side of the Hu Line from 2016 to 2019. The results imply that the government’s future poverty reduction policies should pay attention to the infrastructure construction in poor areas and appropriately increase the population density in poor areas. This study fills the gap in the research on poverty reduction under multiple scales and provides useful implications for the government’s poverty reduction policy.
Keywords
Poverty reduction efficiency (PRE); driving forces; multisource big data; deep learning; random forest (RF)
Full Text Download
Geo-spatial Information Science
Q.E.D.